如何嵌入Google Analytics图表到你的网站并使用服务端授权
如果你正在使用Google Anlaytics工具来分析网站访问数据,你可能会想将它提供的各种酷炫图表嵌入到网站页面以供用户浏览。尽管Google Analytics并不提供简单的iframe方式来嵌入图表,它还是提供了Google Analytics Embed API这种需要稍微多一点技术基础的方式让你能够嵌入它们的图表。我会在这篇文章里详细地告诉你该如何一步一步实现一个Google Analytics图表。
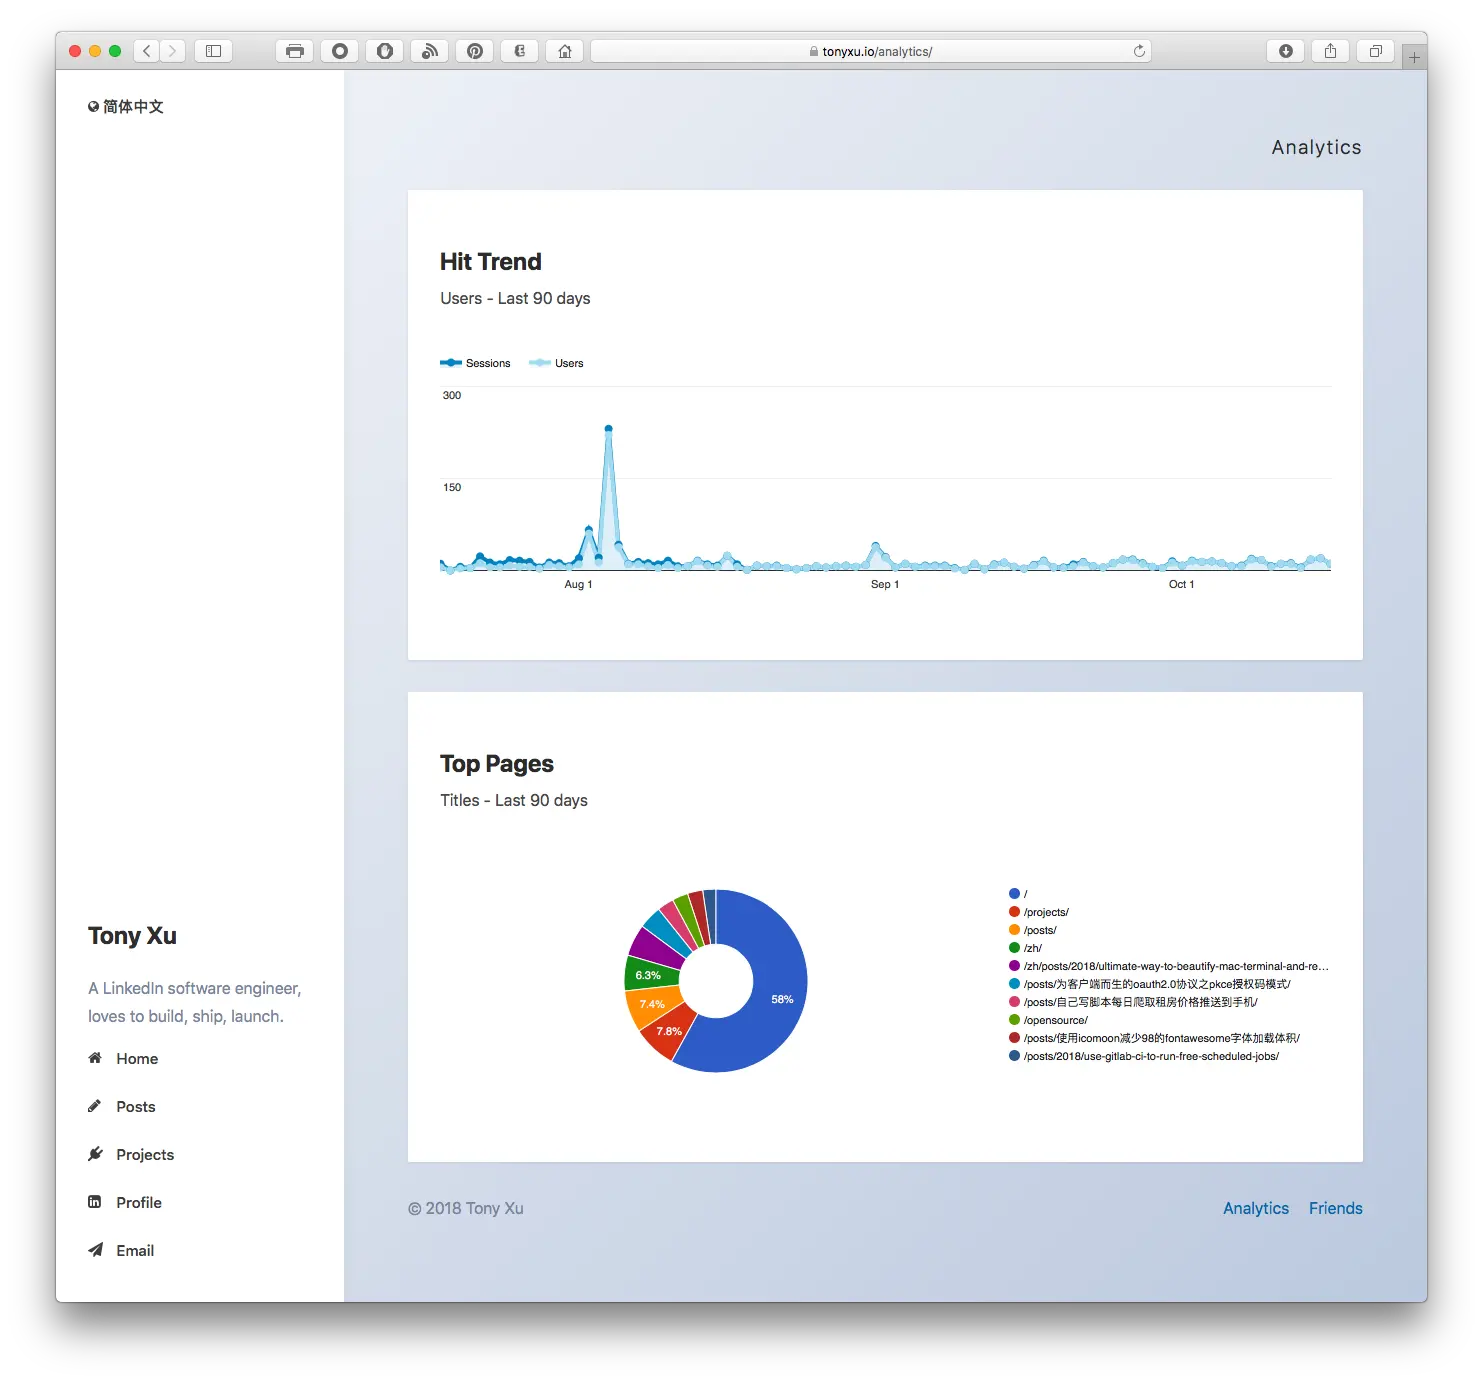
效果预览:
1. 在Google Developers Console创建云项目
(如果你已经有项目了请忽略这一步)
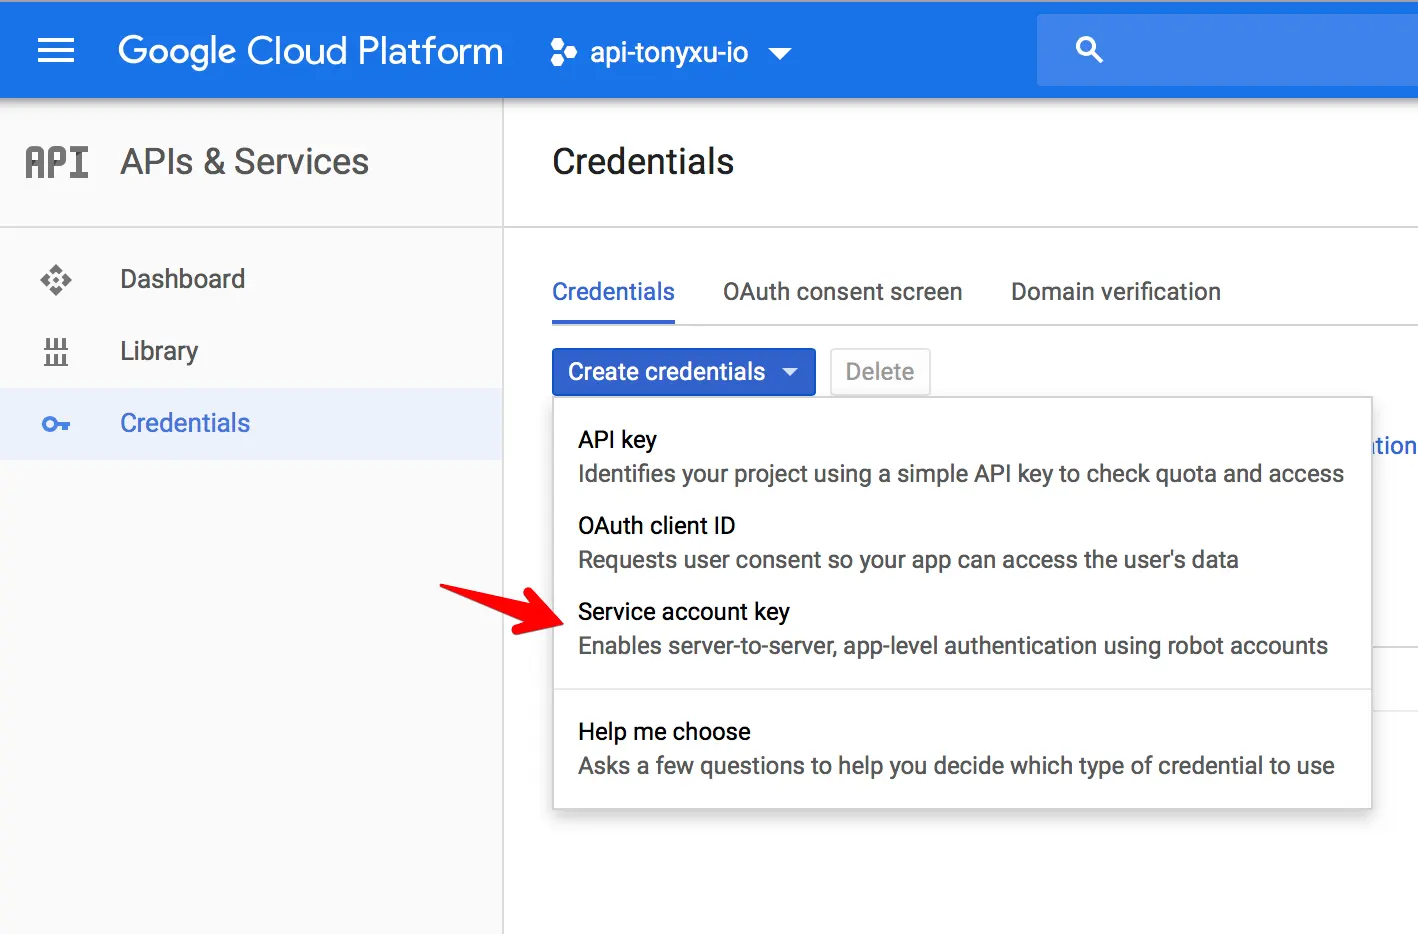
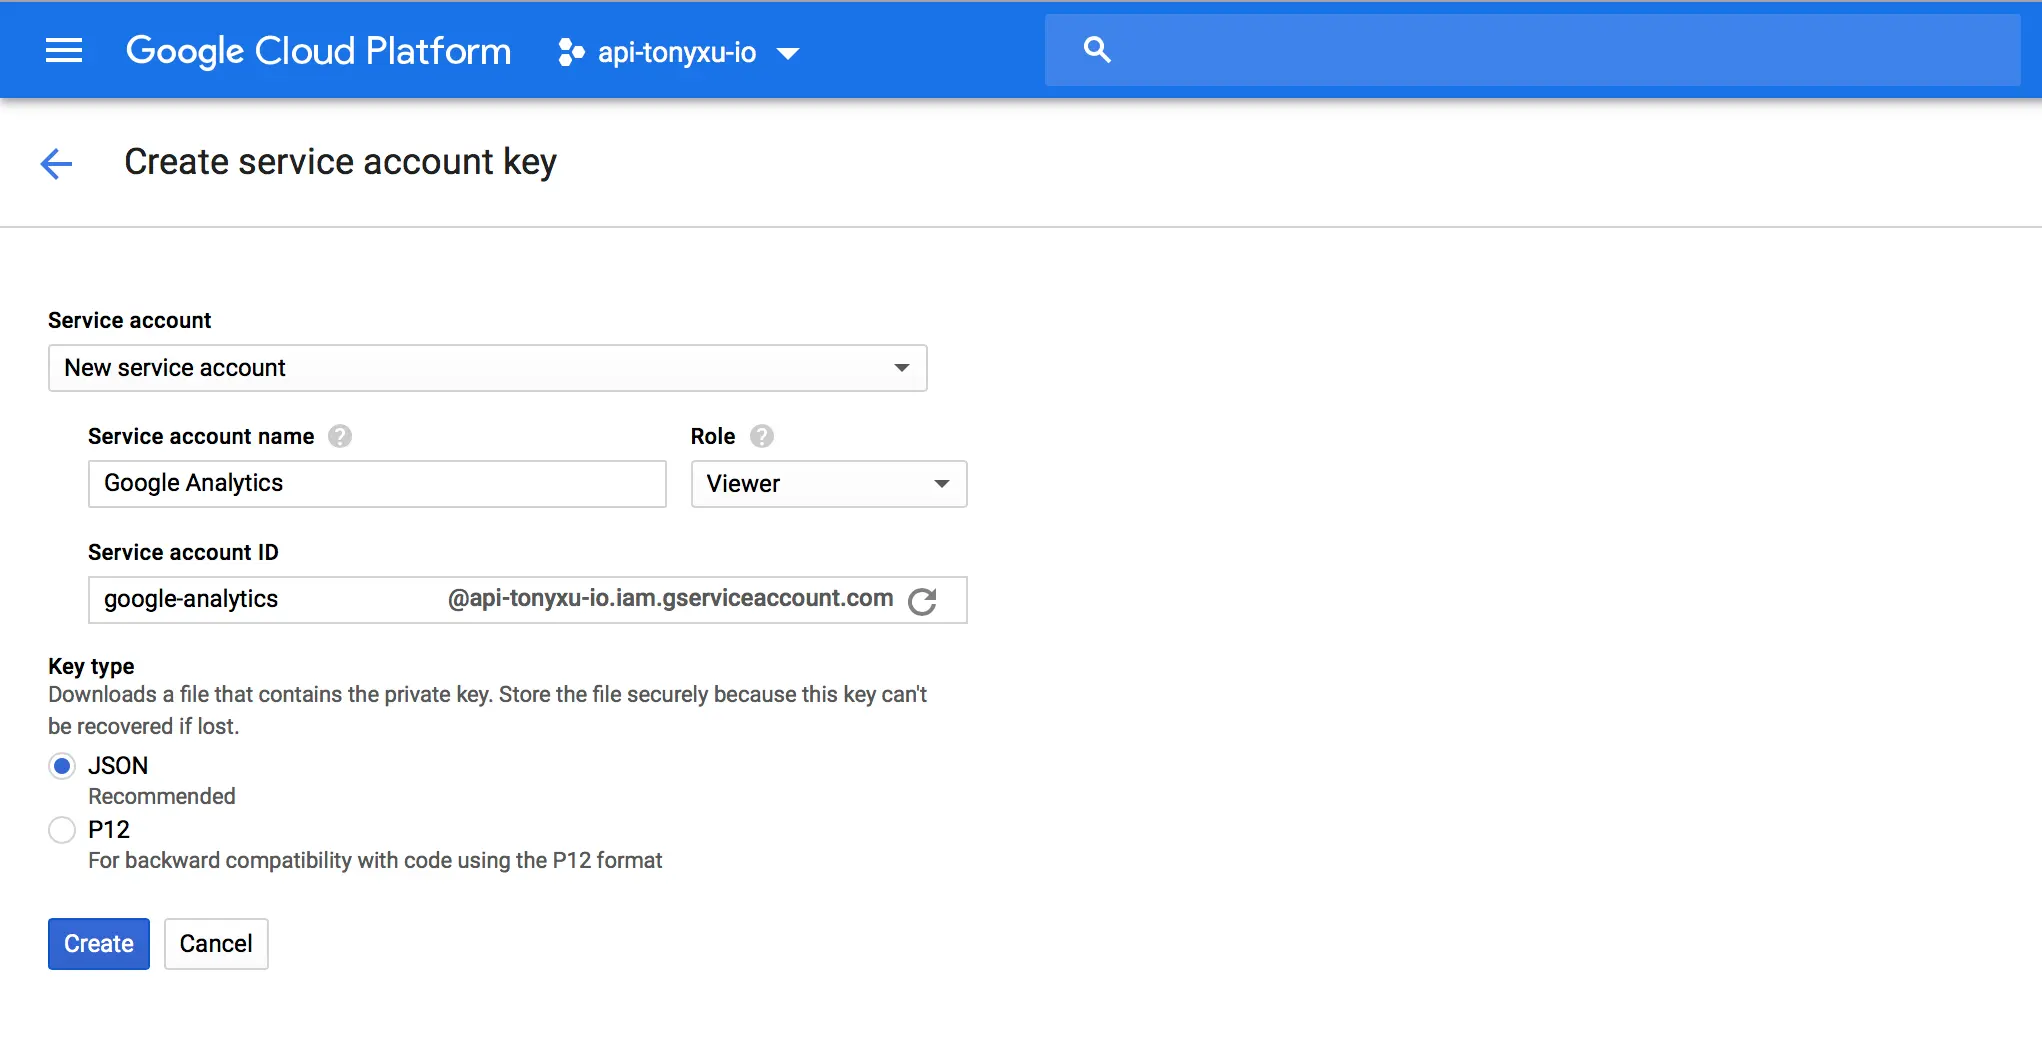
2. 创建服务账号(service account)并下载.json密钥文件
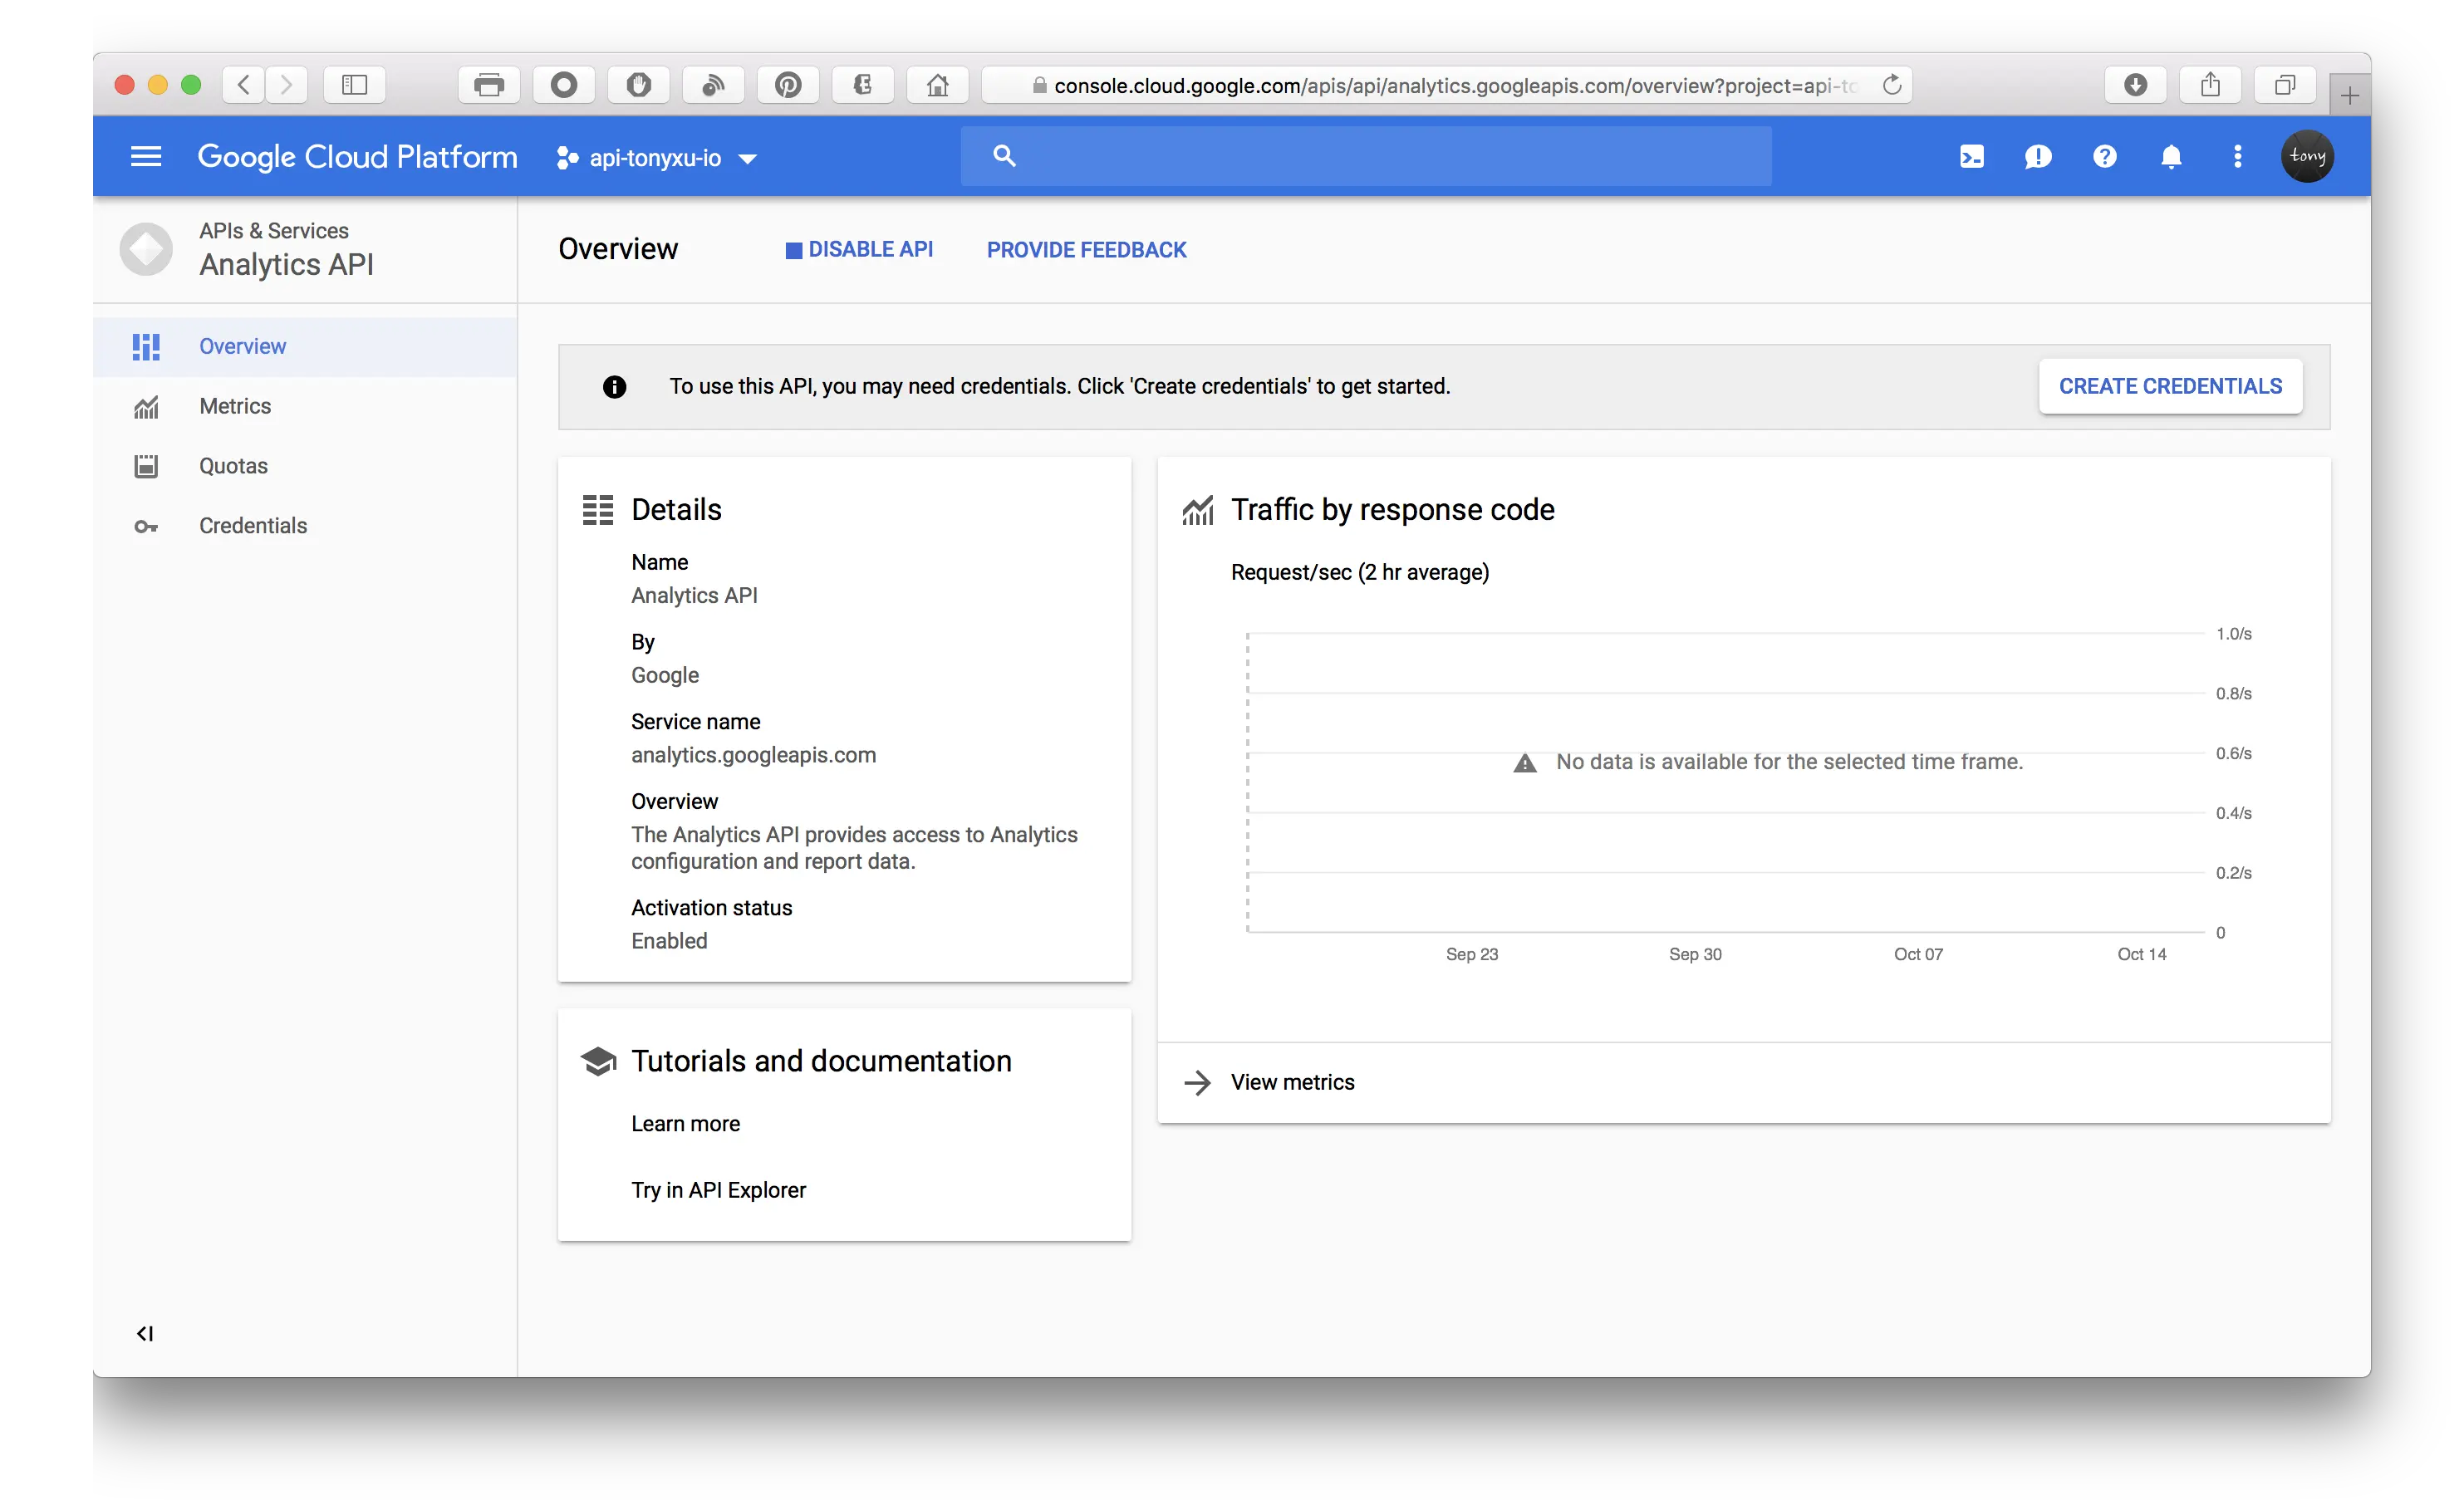
3. 启用Google Analytics API权限
4. 允许云服务账号(service account)访问Google Analytics数据
获取云服务账号邮箱地址
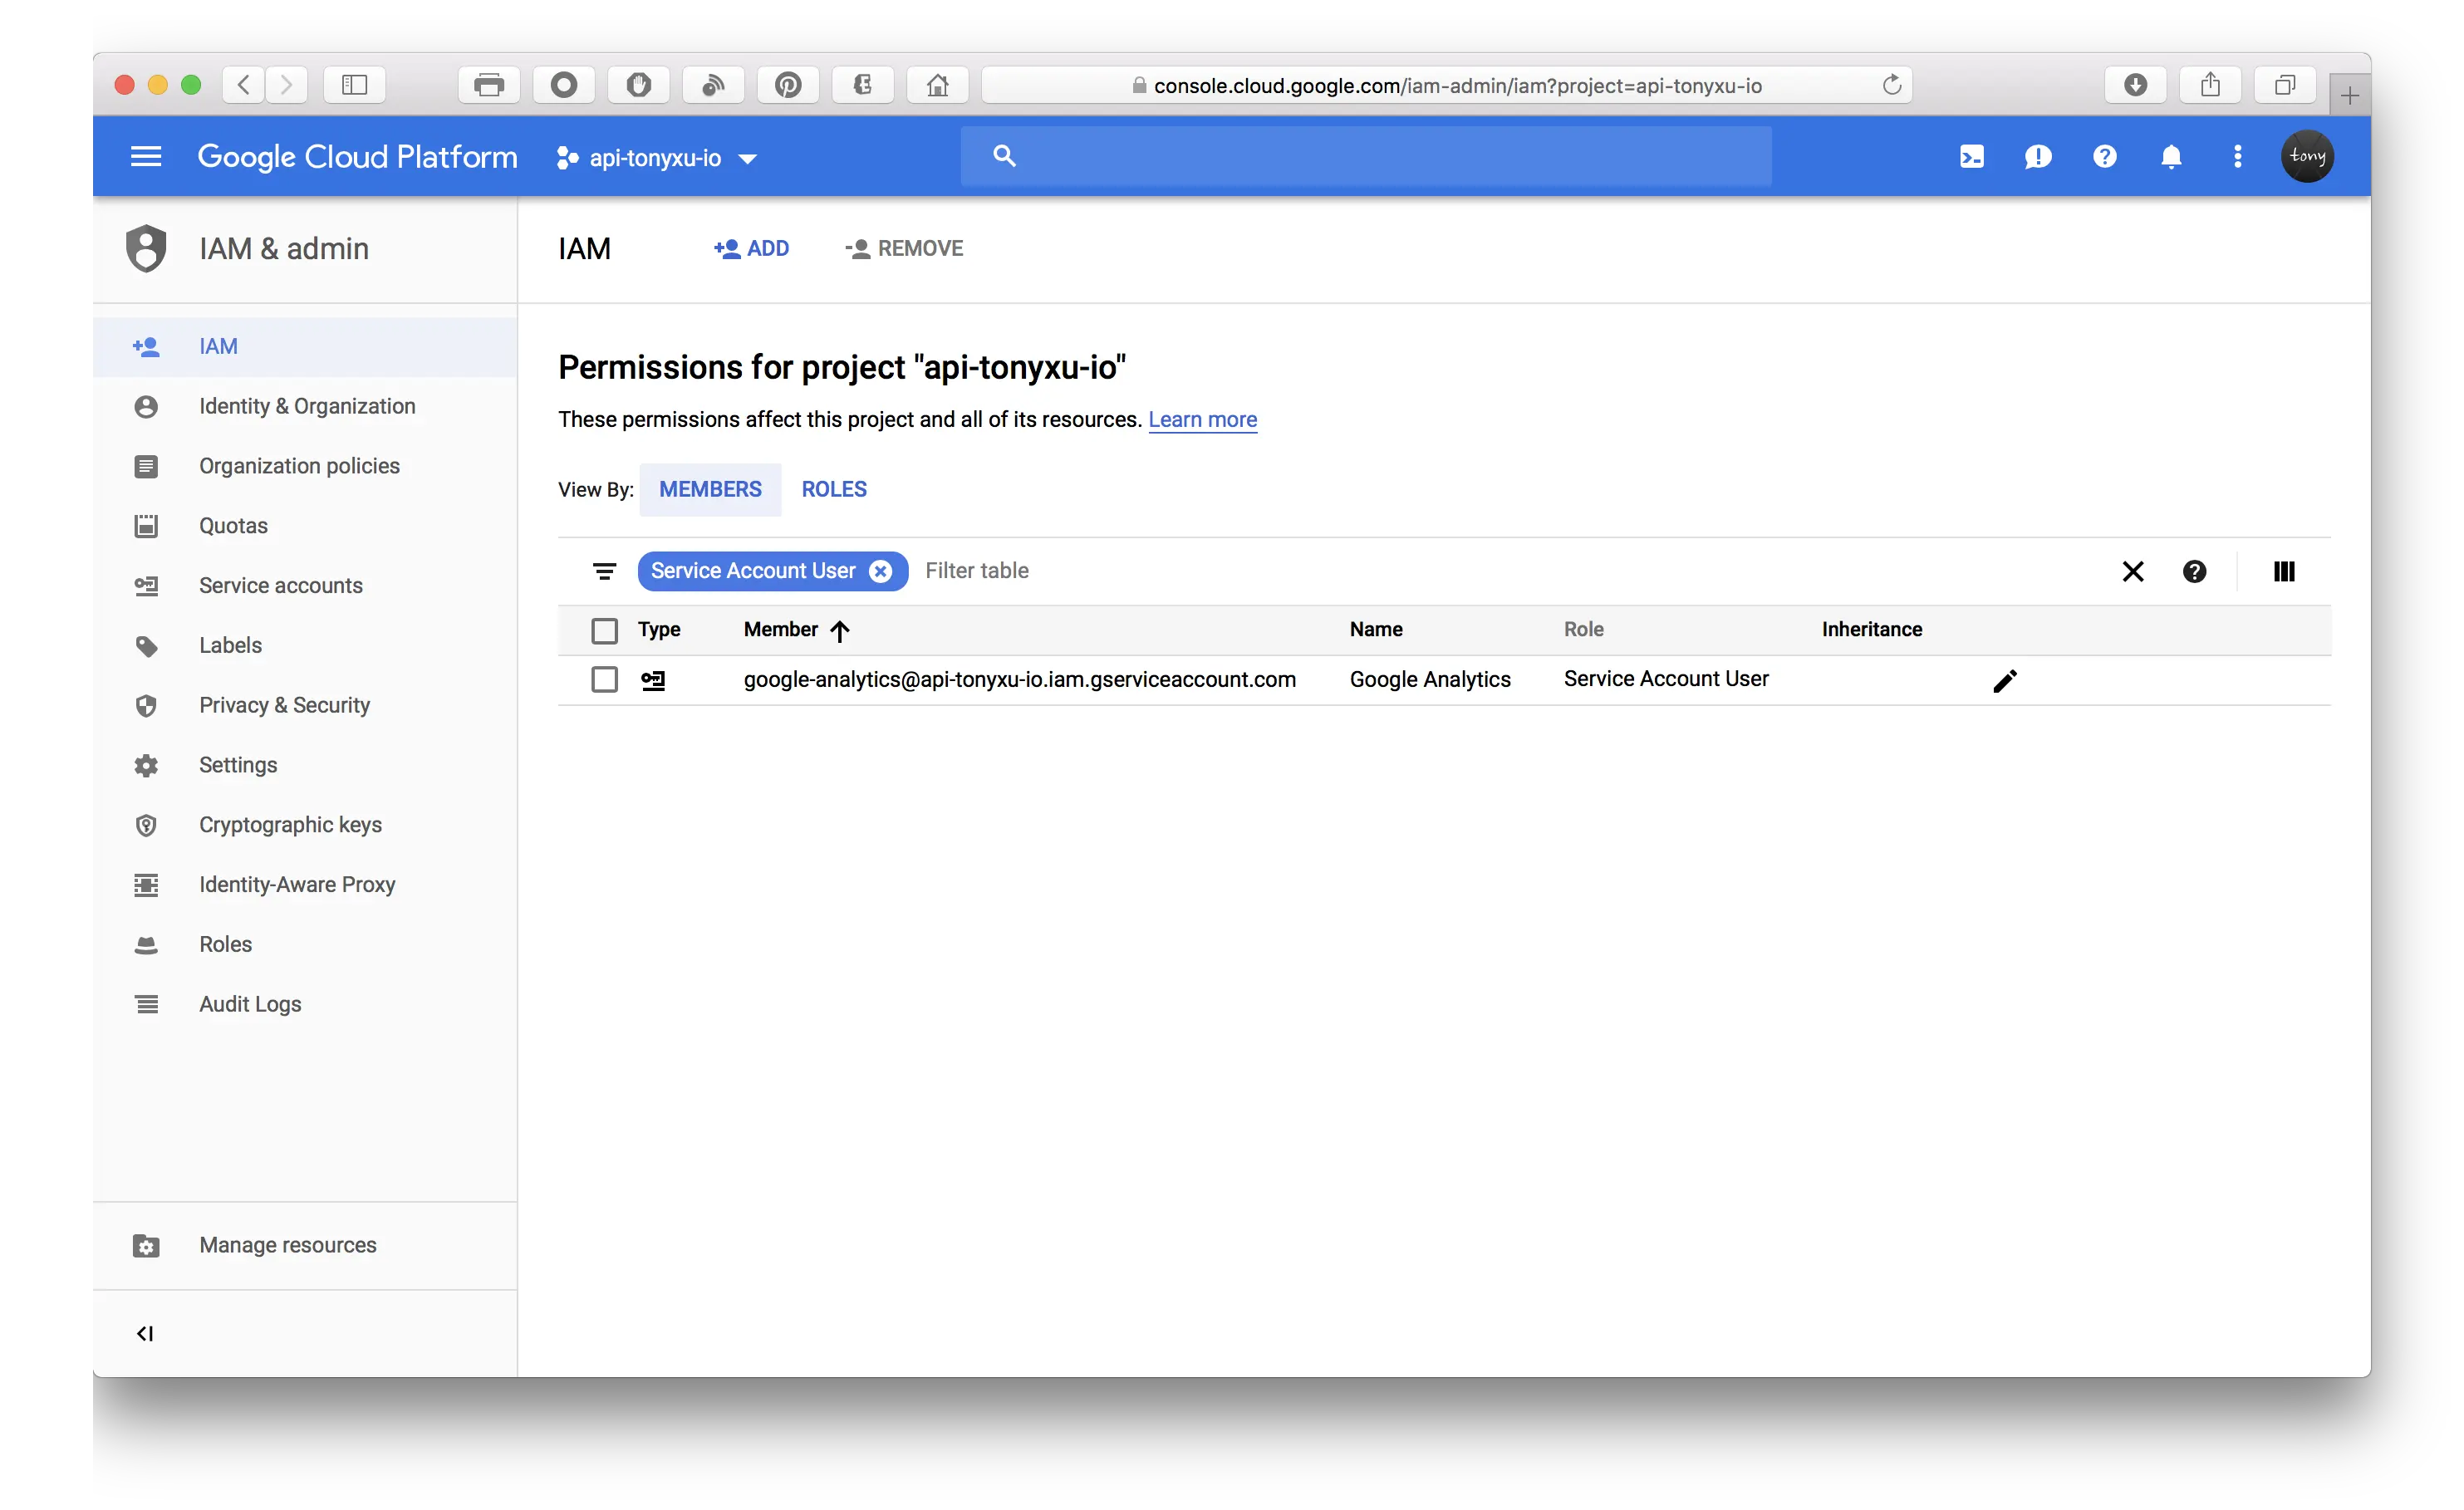
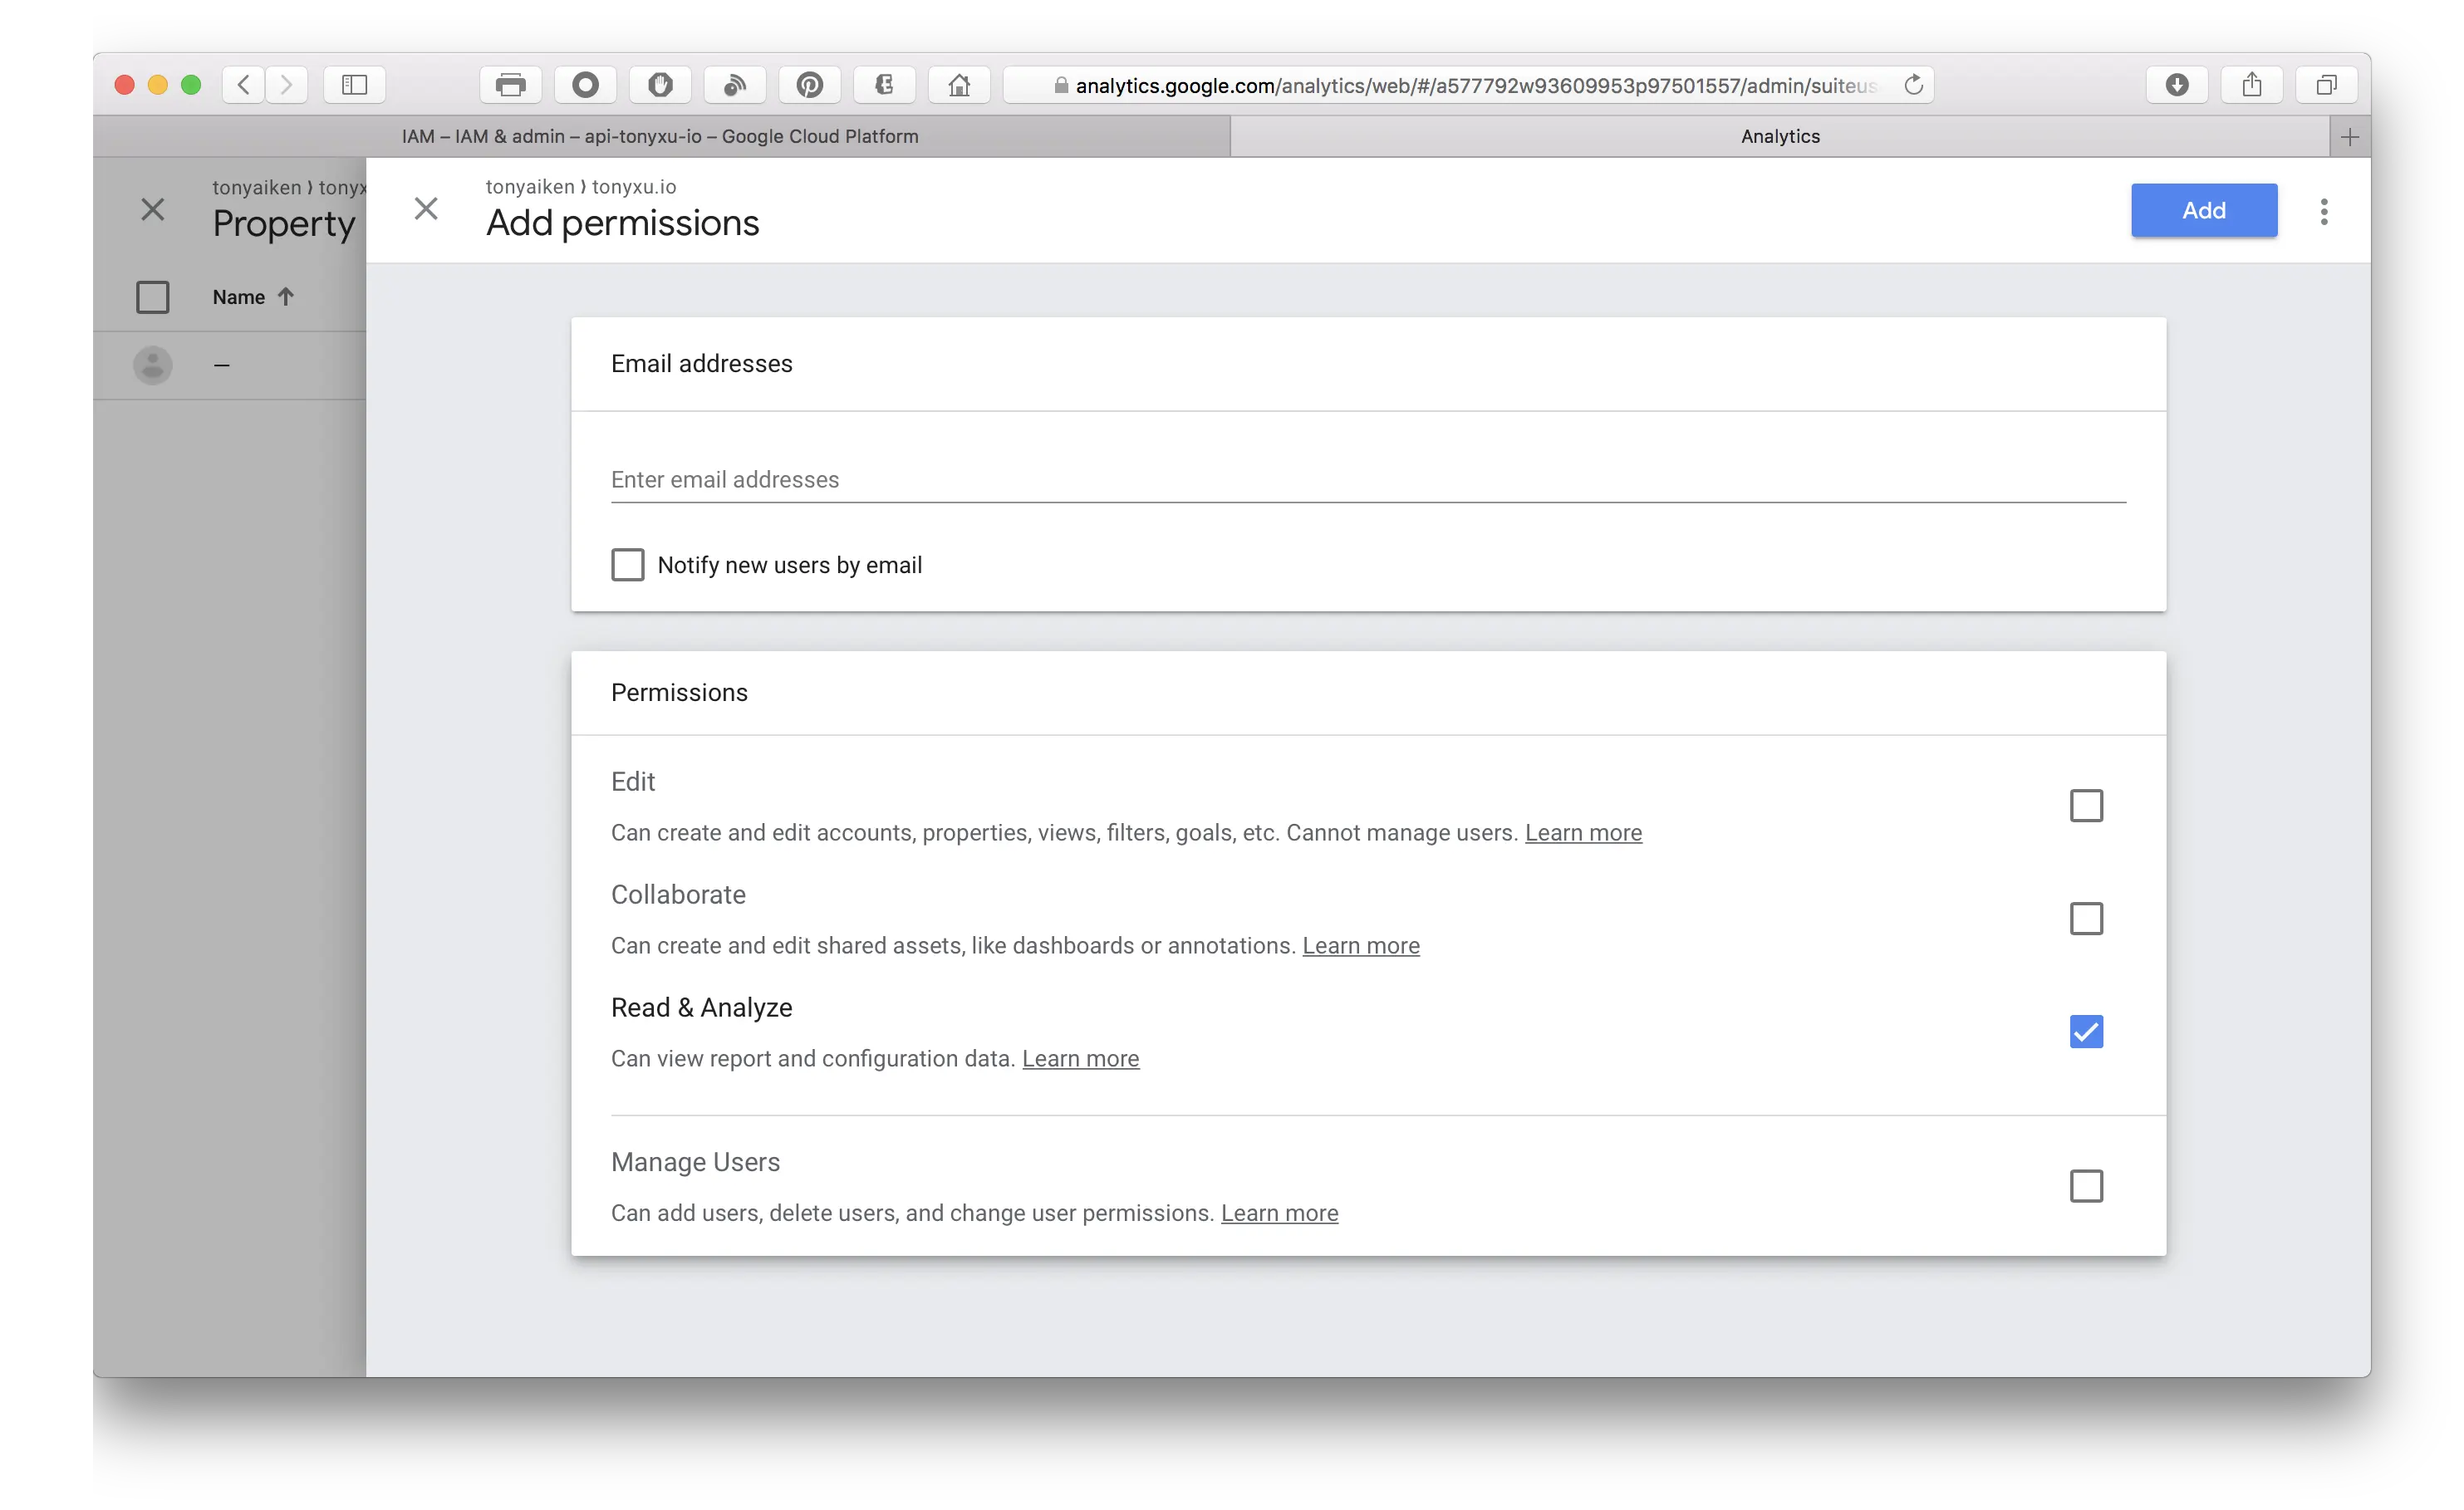
添加为Google Analytics只读用户
5. 在服务器生成访问令牌(access token)
我们在服务器生成访问令牌并返回给前端,因此用户不需要在浏览器登录Google获取访问令牌。
Node.js服务器部分实现
Install Google API Client Library
npm install --save googleapisImport service account key
let privateKey = require("./google_key.json");Return Google access token to client
// https://your-domain/accessTokens 将会返回Google访问令牌给前段
app.get("/accessTokens", (req, res) => {
  let { google } = require("googleapis");
  let privateKey = require("./google_key.json");

  // JWT认证
  let jwtClient = new google.auth.JWT(
    privateKey.client_email,
    null,
    privateKey.private_key,
    "https://www.googleapis.com/auth/analytics.readonly",
  );

  jwtClient.authorize(function (err, token) {
    if (err) {
      console.log(err);
      return res.status(500).send("Error");
    } else {
      return res.send(token.access_token);
    }
  });
});
Python服务器部分实现
安装Google API Client Library
sudo pip install --upgrade google-api-python-client返回Google访问令牌到前端
# service-account.py

from oauth2client.service_account import ServiceAccountCredentials

# 获取Google Analytics数据权限
SCOPE = 'https://www.googleapis.com/auth/analytics.readonly'

# json密钥文件的路径
KEY_FILEPATH = 'path/to/json-key.json'

# 定义一个方法从服务账号对象获取访问令牌(access token)
def get_access_token():
  return ServiceAccountCredentials.from_json_keyfile_name(
      KEY_FILEPATH, SCOPE).get_access_token().access_token
6. 加载Google Analytics Embed API库
<script>
  (function (w, d, s, g, js, fs) {
    g = w.gapi || (w.gapi = {});
    g.analytics = {
      q: [],
      ready: function (f) {
        this.q.push(f);
      },
    };
    js = d.createElement(s);
    fs = d.getElementsByTagName(s)[0];
    js.src = "https://apis.google.com/js/platform.js";
    fs.parentNode.insertBefore(js, fs);
    js.onload = function () {
      g.load("analytics");
    };
  })(window, document, "script");
</script>
7. 添加HTML容器用来加载图表
<div id="chart-1-container"></div>
<div id="chart-2-container"></div>
8. 获取Google访问令牌并加载图表
<script>
  gapi.analytics.ready(function () {
    fetch("/api/accessTokens").then(function (response) {
      gapi.analytics.auth.authorize({
        serverAuth: {
          access_token: response,
        },
      });
      dataChart1.execute();
      dataChart2.execute();
    });

    var dataChart1 = new gapi.analytics.googleCharts.DataChart({
      query: {
        ids: "ga:00000000", // <-- 替换为你的统计报告ID
        "start-date": "90daysAgo",
        "end-date": "today",
        metrics: "ga:sessions,ga:users",
        dimensions: "ga:date",
      },
      chart: {
        container: "chart-1-container",
        type: "LINE",
        options: {
          width: "100%",
        },
      },
    });

    var dataChart2 = new gapi.analytics.googleCharts.DataChart({
      query: {
        ids: "ga:00000000", // <-- 替换为你的统计报告ID
        "start-date": "90daysAgo",
        "end-date": "today",
        metrics:
          "ga:pageviews,ga:uniquePageviews,ga:timeOnPage,ga:bounces,ga:entrances,ga:exits",
        sort: "-ga:pageviews",
        dimensions: "ga:pagePath",
        "max-results": 10,
      },
      chart: {
        container: "chart-2-container",
        type: "PIE",
        options: {
          width: "100%",
          pieHole: 0.4,
        },
      },
    });
  });
</script>
参考资料:
- Google Analytics Embed API - Server-side Authorization
- Google Analytics Embed API - Built-in Components Reference